Friday 29 April 2016

,

SDSSB Comments 9 - Design and Aesthetics


“...art is about asking questions, questions that may not be answerable” (Maeda, 2012)

Synthetic Biology has been able to bring different species together: artists, designers, scientists, and engineers. I think, an important discussion by Agapakis (2013) and Ginsberg (2014) is the differences in “design mindset” of these species in their respective fields. Both argues that designing synthetic biology within the paradigm of industrialization will limit its future into the so called “myopic & monolithic” consumptive industrial biotechnology. Agapakis (2013) explains that, while synthetic biology brings analytic science to technology and innovation, design will bring technology to society. Opening dialogue between these species would provoke more questions and discussion to where the future of synthetic biology will head on. Explorative imagination of art and design (bioartist) would open new ideas and possible futures for synthetic biology (Yetisen, 2015).

Another keypoints from the papers is the idea that synthetic biology will have different, or maybe its own definition of design. While engineers always long for standardization and predictability, we cannot ignore the fact that designing a complex living system will not be fully predictable. Acknowledging the unpredictability of designing living system will bring another perspective on design, the “speculative design”, that will likely to be working in the social and environmental context of the real world:

“we should approach the design of biological systems with more humility and with design principles that are more biological, emphasizing not control but adaptability, not streamlining but robustness, and not abstraction but complexity” Agapakis (2013)

An interesting part is on p.xviii of Ginsberg (2014):

“Some people assumed that our aim is outreach: a public relations activity on behalf synthetic biology to beautify, package, sanitize, and better communicate the science.”

It is a proof that some people involved in synthetic biology (especially with certain political/industrial standing) still view the translation of science and technology is one way, like the central dogma mentioned in Agapakis (2013). Art and design truly can bring dialogues and more future possibilities to synthetic biology. But, when synthetic biology is heavily commercialised, will this bioart, the “expressions of discord and controversy” (Yetisen, 2015), be heard by those with policy making power?

Additional references

Maeda, J. 2012. How art, technology and design inform creative leaders. TED Talk. Available:    https://www.ted.com/talks/john_maeda_how_art_technology_and_design_inform_creative_leaders

Continue reading SDSSB Comments 9 - Design and Aesthetics
,

SDSSB Comments 8 - Past and Futures


Brown et al. (2006) gave us a good example of how scientific expectations, both hype and dissapointment, have shaped the history of scientific development in the case of Hematopoietic Stem Cell (HSC), which was stated as one of the most valuable stem cell in bioeconomy. I think, in 2006, Brown et al. addreses the change of interest from HSC towards human Embryonic Stem Cell (hESC) which promises a lot of things. From the history of HSC, we can understand that a there were a lot of expectation when a new information/technology was founded (even though it is still poorly understood), but dissapointment came when the expectation was not met, Of course, there were a lot of political and economical background in the announcement of new technologies. The same goes with Nordman & Rip (2009) on the ethical aspect of nanotechnology, where more pressing development receive less attention with the more “hype-ning” futuristic issues. Thus, the history (both hype and dissapointment) might shape future decision or trends of the emerging field.

Danielli’s prediction of the future biology is quite fascinating, and accurate. Interestingly, this perspective on the future seems to be responded differently in comparison when the human genome project was announced. A perspective which at the time seems futuristic has been responded with so much hype when the human genome was announced. But, what was achieved in 2000 was a beginning of the genomic era, yet overly hyped by the press release authors. It is good to bear in mind that the claims and hopes stated in the press release might take longer to became reality.

It is not easy to make balanced expectation to certain technological advances due to personal bias. But as Nordman & Rip (2009) proposes, a more interdisciplinary discussion and “reality check” might help us to get balanced expectation. Predicting the future is of course an important issue for both policymakers and business, but will “promissory capitalization” or “biovalue” shaped our scientific discovery trends in the future? Would it limit our creativity to explore? So how should we think and chose to innovate in the future? In this case, I would like to quote Joi Ito’s (2012) idea on compass over maps:

“The idea is that in a world of massive complexity, speed, and diversity, the cost of mapping and planning details often exceeds the cost of just doing something–and the maps are often wrong”

 References

Ito, J. 2012. Compasses Over Maps. MIT Media Lab Blog. Available from: http://blog.media.mit.edu/2012/07/compasses-over-maps.html
Continue reading SDSSB Comments 8 - Past and Futures
,

SDSSB Comments 7 - Synthetic Biology and the Public Good


Calvert and Emma (2013) starts the discussion with an interesting argument: “science is part of society and society is part of science”. Even so, the paradigm lies to distinct between the scientist, engineers, and policy makers, with the public. Indeed, both scientist, engineers, policy makers, and industry regards “the public” as an important entity to dealt with. Joly and Rip (2007) reported how public opinions have important influence in the development of science and policy by using the case of genetically modified vines by INRA. Another report (Hayden, 2014) shows that synthetic biology business firms really depends on the “public acceptance” of their product. In this particular case, the public was boldly positioned as “the consumer”. Thus, there is a perspective that the development of a disruptive technology, like Synthetic Biology, desperately trying to get “public acceptance”.

Calvert and Emma (2013) and also Wickson et. al. (2010) argues for a perspective change in the position of public within the development of a new and disruptive technology. Calvert and Emma (2013) suggest that changing the frame from “public acceptance” to “public good”. This is achieved by recognizing the public as a heterogeneous groups of citizen engage them in the development of the technology. Synthetic Biology as public goods should be developed through ongoing concern and dialogue with public interest.

But of course, in order to achieve this two way dialogue, as implied in Wickson et al. (2010), we need citizens which actively engage to democratise science and technology development. It is therefore a reminder for us how scientific literacy is needed to realize the ideal public engagement in the development of Synthetic Biology. In reality, there are a lots of part in the world that this still cannot achieved (where citizen can actively engaged in scientific development and policies) due to a lot of circumstances. It is therefore, I think is important for the academia, which was entrusted by the public as the “agent of change”, to be modest and responsible for their act and innovation to contribute as public goods.
Continue reading SDSSB Comments 7 - Synthetic Biology and the Public Good
,

SDSSB Comments 6 - Governance and Regulation


The 1975 Asilomar conference was presented in the unique press narration, entertaining and satire, in the popular Rolling Stones magazine. The conference aims to come up with an agreed regulation on the new disruptive technology. The emerging recombinant DNA technology was predicted, and has been proofed, to have great impact on today’s biotechnology, with risks that is also considerable. Michael Rogers, a press, told the story of the congress somewhat like a group of nerds discussing about the end of the world in an isolated conference. What shocked me though, was the response in page 39: “But what about the press?” (Rogers, 1975). Its as if the scientist and the public was from a diferent species.

Hurlbut et al., (2015) reflects on the 1975 Asilomar Conference to critics the upcoming NAS-NAM plan to CRISPR, the disruptive gene-editing technology, for its ethical, legal, and social implication. Hurlbut argues that the Asilomar conference is an example where an important regulation on a disruptive technology does not involves the opinion of public. Thus, the governance of gene editing technology, and the NAS-NAM plan, should be more democratic. In order to achieve that, the discussion should take note four themes: Envisioning futures, distribution, trust, and provisionality (page 3).

I agree that science policy should involve the wider public, because we all have rights and would be affected by the impact of the technology. Scientist could be depicted as arrogant, paranoid, and enclosed in his “research world”. But I think the science culture from Asilomar 1975 and today’s academia has changed. The interdisciplinarity of today’s academic have brought critical minds to address new technologies and challenges. Good education has given scientific literacy to the public, which is a keypoint for public contribution in the policy making. To  govern a technology with considerable uncertainty in both applications and implications, a thorough discussion between politician, scientist, and public should be well designed. Decision should be made through thorough analysis by world leaders, with the expertise of scientist and taken account the public opinion.
Continue reading SDSSB Comments 6 - Governance and Regulation
,

SDSSB Comments 5 - Bioethics


Knowledge is value-neutral. The value depends on its user. Or is it? Douglas & Savulescu (2010) addresses three issues regarding concerns in Synthetic Biology: (1) it is playing god (?), (2) the distinction between living things and machines, and (3) knowledge misuse, which could leads to bioterrorism or warfare. On playing God, I think as long as it is within the reach of human knowledge, then it is not in the domain of God. It is true that the “openness” of Synthetic Biology could lead to many safety risks, but comparing them to the nuclear warfare is too much. Became paranoid or embrace the possibilities? Proceed with caution, develop risk reduction strategies, but don’t let fear limit our creativity.

What I found more interesting is:

“...that we will misjudge the moral status of the new entities that synthetic biologist may produce” (Douglas & Savulescu (2010, p. 689)

Human has always tried to define and categorize what is living being and what is not, what is their rights and moral status. What is a person and what is the value of life? Harris (1999) choses that a “creature capable of valuing its own existence” as a person, and thus explain its right to exist. And what interesting is, that individual have different moral significance: from potential, pre-person, to actual person. So, how do we know other being than human value their existence? Is it right to give gradual moral significance? What about animals and the creations of synthetic biology?

Regan (1985) argues that theories for animal rights (indirect duties, utilitarism, contractiarism) should be applicable to human rights too. If not, then its wrong. Regan views that all subject of life have inherent value, which is the value as individual to deny discrimination and weighting benefit cannot be used to violate the rights.

So, as synthetic biologists, how are we going to address the moral status of our “creation”? To be honest, I don’t know where to stand. Can logic judges what is right and what is wrong? Is it the time to hear what our heart speaks? Should we question our humanity?

Continue reading SDSSB Comments 5 - Bioethics
,

SDSSB Comments 4 - Synthetic Biology as Open Science?


I envy Drew Endy’s vision on Synthetic Biology. I personally think that IGEM and the Biobricks Foundation starts because of Endy’s personal will to open biology and make it easier to engineer, because he himself was not a “life sciences-trained” academia. Nevertheless, in Endy’s plenary talk (2008), there are two solutions to make this dream happens: (1) involves more people, and (2) development of better tools. And I think it did well. The growing SynBio community has driven innovation to accessible tools and open repositories such as wetware.org. The need for ‘standard exchange format’ has been solved as the SBOL through collaborative attempt from the community members (Galdzicki et al., 2014).

The promise of Synthetic Biology was one of the driving power of DIY-Bio movement in the past decade. But, it’s not just the affordable tools or the “easyness” of Synthetic Biology that drives the DIY-Bio movement. The concept of boundary (Meyer, 2013, p129): between amateurs and professional, big-bio and small-bio, is an important drive for the rise of open biology movement. These DIYBio were the expression of breaking this boundaries.

Current DIYBio communities were mostly born from the previous established hackerspaces or makerspaces, which are mostly have background outside biology. As Jorgensen (2012) said, “...the press had a tendency to overestimate our capabilities and underestimate our ethics”, due to limited access to technology and different regulations around the world, I wonder how many DIYBio group actually did Synthetic Biology?

DIYBio community was shaped by its members, each with different background and visions but shared through Do-It-With-Others (DIWO) principles. What I found interesting from Meyer (2013), is that the European DIYBio states that they found themselves different from the US community. So, how does the geography affects the cultural differences between each DIYBio movement? Were there really a different view between the US, EU, and Asia communities? Will it affect the practice of sharing and openness, or even safety and security approach, in each DIYBio communities
Continue reading SDSSB Comments 4 - Synthetic Biology as Open Science?
,

SDSSB Comments 3 - Ways of Owning


In the last decade, systems and synthetic biology has advanced biology with novel ideas and applications which interests the public, the enterprises, and the academia. As a “hot” topic, Nelson (2014) reported the current issues we have today, the two cultures which debates wether this domain should be “publicly owned” or “privately owned”. But, the question to be asked are (1) what can be patented? and (2) how it will affect the society and innovation.

Calvert (2008) gives an insight on the commodification (the transformation of goods into object of trade) of biological entities. As also stated in Pottage, a commodity should be well defined before disclosured as patent. The problem with the biology, and life itself, that it is dynamic and complex. The reductionism of biology into its molecular parts doesn’t answer emergence properties of living systems, which is the goods that we seek to be commodified. But, Systems Biology which address the holistic interaction of biological systems doesn’t seem to suit the patenting system. Synthetic Biology in the other hand, thorugh its modularity and “predictability” are more suitable for patents.

Pottage (2009) gives insight on how intelectual property became important issue for lots of segment by using Venter’s patent on protocell. As a minimal genome chassis, protocell would a potential core technology to be used as a platform in synthetic biology. Interestingly as it says in p173, the patent may be aimed to gain control to all minimal genome technology. What I understand from the paper, patent enables inventor to disclose (making known to public) and protects their invention in the market (p167). But, restrictice licensing in core technology may results in “Tragedy of anti commons” and became a hindrance in innovation and Venter’s patent need to be given more attention for this.

Protecting Intelectual Property is important for scientist and innovators. In this era where science and technology became very valuable for business, I see that research outputs in academia tends to put lots of efforts in patenting. Will this perspective changes our research trends in the future? I personally believe that the collaborative power of the “crowd” and open source licensing are the powerful drive to innnovate Systems & Synthetic Biology in the future.
Continue reading SDSSB Comments 3 - Ways of Owning
,

SDSSB Comments 2 - Systems Biology and Science Policy


As science and technology deemed important in the progression of humanity, scientific findings moved from “individual artist” in their own laboratory into today’s global scientific society with its culture and policies. Science has come to be an important thing: it is a country’s asset, the driver of new business and industries, and a way to make a living for academia. Therefore, a science policy can affect different aspects not just in the scientific society.

As implied in Macilwain (2011), the investigation to understand how living things work has come to a change of approach, evolved from the reductionist view into the more holistic view of Systems Biology. It promises to bring more sophisticated and complete understanding of human biology, enabling advances in predictive, personalized, preventive and participatory medicine (Hood et al., 2009). This has led the funding bodies to “invest” in Systems Biology, creating new centers around the globe.

The sad story of the MIB (Bain et al., 2014) shows how science policy have a big impact in the development of a research field and the people working in it. Indeed, modelling the Yeast cell is a key to understand how a human cell works, and ultimately “how to battle cancer”. Living cells are not the easiest to work with, but promises need to be fulfilled to the funding agencies. It is then, through research grant reports, the policy makers decide which sector need to be pushed forward or not.

Todays science policy maker are government and Industry. They want the output of research which benefits the country or the business. But the nature of science itself is uncertainty. Scientists jump into uncharted waters, trying to get new knowledge for humanity. But this knowledge may not be beneficial in a clear way. Even “failures” give important information for science to progress.

Does our science policy are the best way to make progress in Systems Biology? Working on systems biology to model living systems indeed have uncertainty aspects of the outcome, but if the science policy is to fund research with a “clear beneficial output”, then it may limit the possibility to explore the “uncharted waters” of biology. Does our science culture (where PI and researchers employed compete for science funding) is already established or it needs to be revolutionized?
Continue reading SDSSB Comments 2 - Systems Biology and Science Policy
,

SDSSB Comments 1 - From Breeding Experiments to Synthetic Biology


Rather than just using philosophical context to define and “limit” a field, I find it more interesting to find what drives the scientific society to gave birth to a new field, both political and technological. It is why, to understand more about Systems and Synthetic Biology, we have to take a look back at the history of its root: Molecular Biology.
The two papers: Abir-Am (1997) and Bud (1998) gave a rather different perspective in the history of Molecular Biology, but both agreed that the foundation of recombinant DNA technology in the 60’s will hold an important point to the development of the Biotechnology Age. What interesting though, the two papers (especially Abir-Arn (1997)) gave a view of how the World Wars and the Cold War play an important role to boost the development of life sciences. Abir-Am (1997) proposes the history of molecular biology in three phases, each influenced by the big “wars”, and how transdiciplinary exact-science has transformed biology into the new age of Biotechnology (chemistry, physics, and mathematics/computer science). Meanwhile, I think Bud (1998) is more conservative, referring Biotechnology came from the early fermentation technologies and the development of new genetic  techniques bring out the “New Biotechnology”. Nevertheless, the dynamic change of science and technology demands upgrade in the research facility, which leds to the new proposal for a new laboratory, and will always happen in the future.
At the end, what drives the new age of molecular Biology today was not the wars anymore, but the business and industry. I wonder if there are political reasons why the authors wrote the papers? On the last paragraph of Bud (1998), I wonder if he state that the genetics-based biotechnology were inspired by traditional biotechnology so does not need to have extra control and therefore give more flexibility for companies to develop their industries in the field?
Continue reading SDSSB Comments 1 - From Breeding Experiments to Synthetic Biology

Sunday 24 April 2016

,

FGT Part 9 - Genomic Profiling

Many diseases are associated with genomic changes in the genome. For example is cancer and genetic disorder. Changes in the genome can be in the form of gaining or loss of genetic material, or rearrangement of whole chromosomes or smaller section of the chromosome. But, difference in genomes between individual is also an important source of diversity. Therefore, it is interesting to try to profile genomic differences in different individual.

One example is profiling breast cancer. This profiling technique involves classification analysis. What is done is that we take many breast cancer samples from different patients, profile them, and group cells together in terms of their expression by microarrays. This way we will get a classification of different groups of patients whose disease shares common properties. Then, we use combination of data (genotyping info) to determine how gene expression changes and figure out what causes the change.

Early application of genome profiling take a lot of samples from each cell line representing differences in genetic diversity, let these cells grow in culture → treat them with drugs (die or survive)→ connect response of drug to an expression profile for each cell line.

Spectra-paratyping
- attach fluorescent label to chromosomes
- selection for the fluorescent label?→ chromosome will lose it?

Leukaemia example
- chromosomal translocation that generates a fusion protein at the juntcion point responsible for the disease state

- here one want to know where the junction point is

Array Comparative Genome Hybridization (aCGH)
ACGH make use of microarrays, mostly done in dual-channel array (almost obsolete, except special applications like aCGH). The idea is to put two probes onto one array, hybridise them, and look at the differences between them. So, we are comparing the sample with unmodified genome (control) as reference. The goal is to find regions of change which common in samples. We expect 1:1 ratio when control & tumour chromosome length is the same. By using order normalised measurement along the chromosome, we can detect loss/gain by looking for shift in the ratio. We might expect for example 1.5 fold increase when gained 1 chromosome for diploid cell, or 2 fold decrease when lost 1 chromosome. 

This technology is very cheap so it is good for population study, and is widely accessible with relatively good resolution. In population studies, we might have lots of samples and lots of genotypes which from that we can see emerging patterns. But, when understanding cancer, the technology become problematic. Because in cancer, genome gets destabilised. and we get some patterns that are random and others patterns that started the change initially. So, how to identify the latter changes This will bring lots of data together). We need to find 'change points' (patterns that change initially and drive disease).

Single Nucleotide Polymorphism (SNP) Array 
SNP Arrays uses the same array technology, but instead of printing oligonucleotides that represent parts of the transcript, oligos represents genomic changes (SNPs). Therefore, we can identify copy number of variations in a population. 

Affymetrix SNP data enables (1) identification of copy number variants using Comparative Genomic Hybridization. (2) Ploidy status, and (3) Loss of heterozygosity, where one parental chromosome is missing causes to duplication of other parental chromosome

Exome Sequencing
Exome sequencing look at SNPs in exonic regions. In assumption that only coded transcript (protein encoding) which have SNPs may lead to changes (might be wrong). Therefore, disease associated SNPs mostly happens there. - identify exons and sequence them→ compare to a reference genome. - in case one has a library of SNPs: can look up difference between reference and sequenced exons in a database → gives confidence if SNPs are credible or error from sequencing
- need the reference!
- kind of a hybride between microarray and sequencing
- cutting down necessary sequencing by 20-fold→ concentrate on exonic regions

Conclusion
- aCGH: cheap, measure lots of samples but relatively low resolution
- SNP Arrays: good resolution but expensive
- Exome sequencing:  more info but more expensive

Proteomics -2D Differential Gel Electrophoresis

The technique separates proteins according to two independent properties in two discrete steps: (1) Isoelectric focusing (IEF), which separates proteins according to their isoelectric points (pI), and (2) SDS-polyacrylamide gel electrophoresis (SDS-PAGE), which separates them according to their molecular weights (MW).

The power of 2-D electrophoresis as a biochemical separation technique has been recognized since its introduction. Its application, however, has become increasingly significant as a result of a number of developments in separation techniques, image analysis, and protein characterization.

2-D Fluorescence Difference Gel Electrophoresis (2-D DIGE) is a variant of two-dimensional gel electrophoresis that offers the possibility to include an internal standard so that all samples—even those run on different gels—can easily be compared and accurately quantitated.


Continue reading FGT Part 9 - Genomic Profiling
,

FGT Part 8 - Emerging Technologies


Technology is what drives Functional Genomics, it allows us to as new question int the genome level. It is possible because technology allows us to ask questions in parallel, through high throughput technology, giving more power to infer new insights.

But, how do we evaluate the robustness of technology?
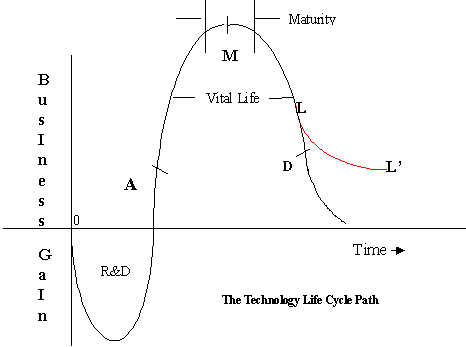
Different risk and benefits conditions are in each stage of technology life cycle:

1. Adopt Early: R & D Stage
While a technology still in the research and development stage, it really depends on external funding to survive. It could rise from industry or academia. But investing in this stage have high risk but also promises high benefit if the technology success. Because, to adopt in this stage means that you have to invest in order to gain early access to the technology. But, because the technology is new, analysis process hasn't been developed. This gives a really challenging opportunity to solve problems which other have not been able to answer and developed analysis methods before competition. It really risky because it may fail and disappear because nobody is interested.

2. Adopt in Ascent
Well, you still have the opportunity to became an early adopter, but the technology is more available and analysis processes are rapidly maturing. The risk become lower because the technology is less likely to fail because it has passed the R & D phase.

3. Adopt in Maturity
Risk are low because the technology is widely available, methods are well established, and commercial developer are stable because they have good income. Many problems have been addressed both in terms of technology development and biological application.

4. Adopt in Decline
Generally it is a bad idea because the access to technology might be lost any time. Most problems should be already answered, or probably better alternatives has been developed. Technology development and expertise is declining and makes the value of the technology become lower.

Current Status of FGT
Expression Microarray, SNP Microarray, are in the mature phase but not yet in decline, although its slowing. Standard RNA-seq and ChIP-seq are in ascent towards mature. Mass spectometry are coming out of R & D phase and into ascent. ChIP-on-chip, Roche454, Helicos, and SOLiD are in decline and some are discontinued.  

Emerging Technology
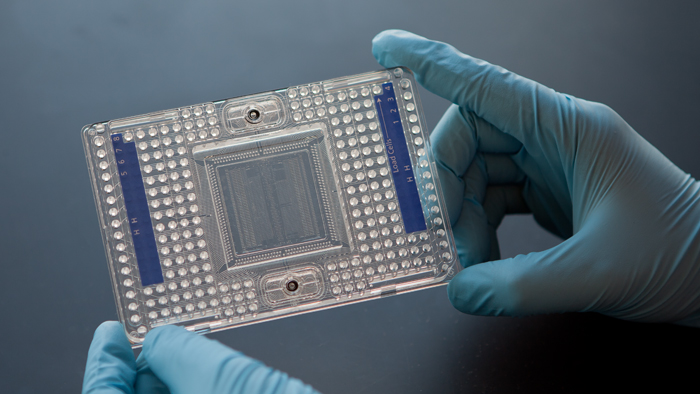
1. High-Throughput Platform: L-1000
The L-1000 platform
Microarray profiling costs a lot of money which limits the amount of samples and replicates. Even though its cheaper than RNA-seq, but it is still a constraint. Learning from microarray platform, basically not all data are changed accross the dataset, we have already identified gene cluster that changes. This means that we don't have to measure all the genes, but we can measure one genes as a proxy for the representative geneset. 

The L-1000 is a bead based technology, it is based on microarrays, but in this case each bead encapsulates nucleotides for running the test. What awesome is that the technology runs on plates (NOT microarrays), which means that they can run in mass and makes them very inexpensive. This high-throughput approach is very valuable for pharmaceutical companies who want to compare all the drugs in their drug collection and work out relationships among these drugs. This is actually an old idea the idea of scaling up and running in parallel is new. Data processing of the platform is very similar to microarray: normalisation, gene expression, clustering. It breaks the record on GEO, it has already submitted lots of data (almost as much data as the entire collection of all the world's record on human profiling in the last ten year) in a very short time (only appeared in a few experiments)!

2. New ChIP-seq & Related Technologies
This new technology are developed to probe the epigenome. Two of this technology are:

a. ChIP-Exonuclease

ChIP-exo overcome the problem found in ChIP-seq where the sequence binding in the TF can only be localised within the purified fragment. In ChIP-seq, antibody will pulls out the protein of interest, purify it, sequence, and analysed to identify the binding peak, then determine exomer motif. The resolution of the technology is relatively small, it cannot tell where the protein exactly binds if one has two binding sites in close proximity. The TF sites is only a few bp, but the fragment are typically few hundreds bp. ChIP-Exo address the problem by using single-stranded exonuclease digestion of ChIP fragments and effectively localises the exact site of TF binding. The exonuclease runs from 5' to 3' and chops DNA until region to which TF is cross-linked and protects DNA. 

b. Conformation Capture Technologies
Conformation capture can analyze folded structure in the chromosome. This 3D structure is hard to measure. The technology captures the spatial connection between bits of chromatin in the genome, ligate and capture, then sequence them. This technology makes an artificial joint between bits of material that are connected and joined together by a common complex.

The technology address the N^2 problem of the genome. This problem means, if any point in the genome can potentially connect to any point in the genome, we will have to do N^2 amount of sequencing to visualize each connection. This is too much sequencing to be done! So, how do we reduce the complexity? If we put in only known regulation sequences, can we see how they connect to each other? If one knows these, one can infer the 3D structure of the genome, which is only 1% of the genome, and its possible to sequence them at a reasonable resolution. In essence, the technology focuses on regulatory regions to captures 3D structure of the genome. 

3. Single Cell Technologies
Right now, we are very interested to analyze a single cell. Why? Because, all the technology above utilises a mixture of cell as a weighted average as sample. This means, one contamination of cell type could change transcription profile and leads to false conclusion. Therfore, by profiling one cell, we can really measure transcript change in a single cell.

But, single cell sequencing are still limited by the affinity of reverse transcriptase for it's template and suffer from amplification biases. There is only 10^5 - 10^6 molecules per cell expressing 10k genes. This small amount need to be amplified. 

Microfluidics allows for the separation of individual cells into wells and process them, one cell at a time, take RNA from single cells, generate probes, then allow reaction for sequencing to be carried in parallel using only tiny amount of volumes. This is ideal for processing a small amount of RNA from 1 or few cell. Microfluidics allow single cell amplification efficiency to be increased. But then, the data is very challenging because only few/tiny amount of transcripts per cell, and the technology still struggles to get representative amplification (rare transcripts are never enough amplified).

Single cell technologu allow us to make new discoveries about cells, with very high resolution. This could reveal a new era in biology. 

For example, the analysis of 'transcription bursting' of single cells which go through cell cycles. In this case, the genes involved in cell cycle became very active and then inactive again. This made statistical analysis to judge for differentially expressed genes, and it turned out to be the cell cycle related genes. Measuring this could make predictions and adjust to the cell's cycle for their measurements.

To control the quality of the platform, spike-in controls (RNAs with known concentrations) can be used to measure quality of amplification. Another approach is to remove amplification bias by counting unique molecules instead of reads. What it means is, how many molecules were in the starting population that was amplified (it represents molecules in that cell)? This perspective gets rid amplification bias. For example, molecules started at the same ratio, one has X and other has 2X. This could have distortion because one amplifies more than another, it collapse down to measure individual molecules in individal cells within individual reactions. The strategy above remove amplification bias by generating a barcode for individual reverse transcription that generates an individual molecule in a ind. rxn from an ind. cell→  can get barcodes and deconvolve information during analysis. single cell has a 90.9% correlation to the averaged, mixed cell population


Drop-seq
- problem: have to sort cells by microfluidic system with flow chambers, expensive, difficult to do
- flow chamber where cells are capture in individual, barcoded beads→ rxn takes place where reverse transcription synthesis is carried out + amplification inside the droplets
- have individual cell and chamber with barcoded oligonucleotides, join those and do synthesise in the droplet→ then, break up and sequence a lot→ know which cell came from which droplet because of barcode
- can generate a transcriptional profile for many individual cells in parallel

Spatial, in situ hybridisation
-  break up cell, do in situ hybridisation on individual components inside 'dots' representing individual cells→ can spatially resolve what cells are next to each other on a dish and predict gene expression

Conclusion
Rapid progress are being made in single cell amplification. Best approaches for this is the composite of available technology: RNA-seq, microfluidics, novel cDNA labelling, etc. Future technology may be a multiomics approach (RNA, DNA, Chromatin, Protein). We already have a technology for measuring the accessibility of the chromatin. So can we then ask which region are accessible for TFs? Can we measure single-cell methylation? The future technology will enables us to ask integrated question on single cells.


Continue reading FGT Part 8 - Emerging Technologies
,

FGT Part 7 - RNA Sequencing


RNA sequencing is the alternative to microarray. RNA sequencing measures population of RNA by generating cDNA with adaptors.

Why choose RNA seq over microarray?

In functional genomics, we are not only interested to see differential expression of genes, but also to see combination of exons which give rise to RNA population. This is difficult because most mRNA expressed never cover entire exonic region. At the moment, we are able to see level of expression, but we do not know splice variants and its interaction with transcription levels. We cannot just see how genome behave by just looking at expression levels.

Other than that, we are also interested to see the importance of non-coding RNA, which is also relevant to the coding RNA. One of the example is microRNA (miRNA), miRNA is a short (~22 nucleotides) which roles is in interference pathway. miRNA controls the expression of mRNA by promoting cleavage, destabilize poly-A tail (increase degradation speed), and make ribosom binding less efficient. But, we need special treatment to measure miRNA.

So, currently, microarray technology cannot answer those questions. This is because, microarray is limited by design and therefore not able to detect novel genes. If the rate of novel discovery of genes is too rapid, microarray will have trouble to keep up in the design.

And, RNA seq could solve those problems.

How it works?

RNA seq was born from the SAGE (Serial analysis of gene expression). In SAGE, mRNA was processed into cDNA tags, which are short sequence of oligos which correspond to certain mRNA. These tags (then called expressed sequence tags or EST) was concatenated, amplified, and sequenced. The result then was mapped to a reference genome, and the tags was counted.

Before attempting RNA seq, RNA sample need to be prepared, Because 99% of the RNA population in the cell came from rRNA, it needs to be removed. this can be done by removing by depletion or poly-A selection for mRNA using magnetic gel beads. For mRNA analysis, cDNA was generated using cDNA primer. The resulting primers than given adaptor and also barcode (for multiplexing). And sequenced!

What do you need to consider when designing RNA-seq experiment?
The aim of the experiment is to find differentially expressed genes. Therefore, experiments must be designed to accurately measure both the counts of each transcript and the variances that are associated with those numbers. The primary thing we need to consider is the same as microarray: (1) The number of replicates in order to estimate within- and among-group variation, (2)

1. Sequence length
First to consider is the sequence length, or how long a read needs to be generated. We need the reads to be long enough because small reads will give high number of hits when referenced to the genome. Around 35-50 bp is long enough to analyze complex genome. Smaller length give more time to reconstruct to be reconstructed, but longer reads can cost more money. Longer reads needs to be considered when analysing splice sites.

2. Sequencing Depth

The depth of sequencing means how many reads or rounds of sequencing need to be done. The depth requirement was estimated by knowing the predicted amount of trancript of interest (is it has low number or high number). Variation due to the sampling process makes a large contribution to the total variance among individuals for transcripts represented by few reads. This means that identifying a treatment effect on genes with shallow coverage is not likely amidst the high sampling noise. More reads will increase sensitivity of the sequencing to detect rare species. But it is limited by the number of unique molecules, so if no more unique molecule present, then no more sequencing by synthesis can happen.

3. Single or Paired End Sequencing
Using Paired End Sequencing could give information on the (1) length and (2) exon prediction. By knowing the starting and ending of a paired sequencing, we can determine exact size of the fragment. This is simply because if we know that a paired end reads correspond to exons, they should be next to each other in the genome.

4. Creating Library: Random run or multiplexing?
The next generation sequencing platform sequence the sample in a flow cell. Using separate flow cell will make the result difficult to compare because of the artefact made in each flow cell, environment conditions, etc. One way to solve this is by multiplexing, which is giving uniqe tags or barcodes to each samples, and mix them together to be read in a single flow cell. This is only limited by the number of unique barcode label available.

General Workflow
1. Mapping to Reference
Mapping of sequence reads to the genome will produce continuous exon islands of mapped read separated by introns. If a reference genome is not available, it can be generated through HTS or we can use available transcript evidence to build gene models and use this models as references. Or use de novo transcript assembly.

2. Quantification
Once the read has been mapped to the genome, exons can be predicted by the islands of expressions. Novel exons can be predicted by annotating the sequence with current database. Splice events can be predicted from sequence using mate pairs or by sequencing across junctions.

3. Normalisation
Because the library contain different numbers of sequences, we might expect that some RNA have more reads in one sample, resulting in under or over representation of the transcripts. To scale the comparison, typically the read was expressed as read per million library read (RPM) or in other words, it is the transcription proportion. But, because longer transcripts accumulate more than the smaller ones, data need to be adjusted and is scaled to reads per kilobase million.

4. Identification of Differentially Expressed Transcript
It is similar with Microarray technology. But the distribution of measurement DE-Seq

Advantages vs Disadvantages 
Overall, microarray and RNA-seq compared quite well. Microarray are limited by the properties of DNA hybridisation, its relatively inexpensive, its mature and established, but it is limited by the design of the array. Meanwhile, RNA-seq offer the ability to discover novel transcripts with high sensitivity (because it counts unique molecule, not the signal background ratio). Other than that, RNA-seq is not limited ny design and therefore it can develop rapidly as knowledge goes further


Continue reading FGT Part 7 - RNA Sequencing
,

FGT Part 5 - Design of Microarray Experiments


Design consideration:
-Identify the key aims
constraining factors
protocols for sample isolation and processing
decide analysis
decide validation
aim to randomise nuisance factors


1. Replication
averaging replicates will give better estimates of the mean. replicates allow statistical inferences to be made.

Biological vs Technical Replication. Techincal ccome from the same sample i ndifferent chips. biological came from different samples. replicates is a scale between biological and technical

3. Level of Inference
Always compromise between precision and generality
what level do conclusion need to be made --> to just the technical sample, to all experiment in cell lines, to  all mices?
More general solution inferences capture more variance
more variablity mena more rep;licates

4. Stastitical issues
a. Level of variability
statistically significant does not always mean biologically significant
b. Multiple testing and False Discovery Rate (FDR)
Usually applies T-Test for each probesets. For each test, P-Values are the probabilities that the test would produce a result as least as extreme assuming the null hypothesis are true. We expect 5% chance that the test result in false positives for multiple test. The FDR was applied to avoid high false positives. Which accounts for the number of test applied.
c. Effect size
How large of a change we want to detect
d. Power
Our ability to discover truth. More replication more power

Common Design Principles
1. Single Factor
varying single factor at once. example with ot wothout drug. for dual channel place comparison of interest near each other. short time can be treatesd on a single factor experiment

-Paired Samples
Microarray experiments with paired designs are often encountered in a clinical setting where for example, samples are isolated from the same patients before and after treatment. Describe the reasons that it might be attractive to employ paired design in microarray experiment!

reduces variability in biological replicates
still captures variability with respect to response between patients

-Pooling vs Amplification
Mutiple isolation are pooled to give enough biological material of the expression level
gives more robust estimation of the expression level
but it can be dominated by one unusual samples
pool only when necessary and consider amplification as alternative
making sub pools is a compromise, ex: pool 15 into 3 x 5
amplificaiton is alternative to overcame limitation due to sample availability
but its not possible to introduce amplification without bias

-Dual Channel Dye Swaps

-Missing measurement

-Practical Design
-Usually limited by cost and sample availability
-consider other experiment for informal estimation parameters
-usually 3-5 replicate for well known strain
or 30-200 for human population inference
consider extendable desing or pilot experiment

Experimental Design Biological questions: Which genes are expressed in a sample? Which genes are differentially expressed (DE) in a treatment, mutant, etc.? Which genes are co-regulated in a series of treatments? Selection of best biological samples and reference Comparisons with minimum number of variables Sample selection: maximum number of expressed genes Alternative reference: pooled RNA of all time points (saves chips) Develop validation and follow-up strategy for expected expression hits e.g. real-time PCR and analysis of transgenics or mutants Choose type of experiment common reference, e.g.: S1 x S1+T1, S1 x S1+T2 paired references, e.g.: S1 x S1+T1, S2 x S2+T1 loop & pooling designs many other designs At least three (two) biological replicates are essential Biological replicates: utilize independently collected biosamples Technical replicates: utilize often the same biosample or RNA pool
Continue reading FGT Part 5 - Design of Microarray Experiments
,

FGT Part 4 - Identifying Differentially Gene Expression in Microarray

Describe the strengths and weakness of filtering on fold change to identify differentially expressed genes from gene expression microarray data

Fold Change
Fold Filtering

When analysing a microarray gene expression dataset it is important to assess the general quality of the data. Describe three methods by which data quality can be assessed. For each method indicate how low and high quality data can be distinguished. 
Check Spike-In
Visual inspection of distribution using scatter plots
Check internal control genes
Check replicate variability

Describe how you might use a scatter plot or MA (MvsA) plot to visually assess the quality of a microarray gene expression data?
M = log2(R/G), log ratio intensity, which means difference between log intensity.
A = 1/2log2(RG) average log intensity
Assume M=0 because most of the gene are not different.
If different apply normalisation

Non-parametric statistical tests can be used as an alternative to parametric statistical test for the identificationof differentially expressed genes in microarray gene expression profiling experiments. Describe in principle how a non-parametric test might be performed and indicate one advantage and one disadvantage of using such test as alternative to parametric test!
Parametric & Non parametric test

Biological consideration
Pooling

Volcano Plot are usually used in the analysis and interpretation of gene expression experiments. What is volcano plot and how it can be used to aid identification of differentially expressed genes?

Describe how functional enrichment analysis can be applied to the results of a microarray experiment. Briefly outline the principle of underlying the calculation of functional enrichment statistics!
Continue reading FGT Part 4 - Identifying Differentially Gene Expression in Microarray
,

FGT Part 3 - Data Normalization for Microarray Data


Why is it important to normalize microarray gene expression data before carrying out data analysis?

The goal of microarray experiment is to identify or compare gene expression pattern through the detection of the expressed mRNA levels between samples. Assuming that the measured intensities for each arrayed gene represent its relative expression level, biologically relevant patterns of expression could be identified by comparing measured expression levels between different states on a gene-by-gene basis.

In microarray experiment, RNA was isolated from the samples (which could be from different tissues, developmental stages, disease states, or drug treated samples), labeled, hybridized to the arrays, washed, and then the intensity of the fluorescent dyes (which is the hybridized target-probes) was scanned. This results in an image data (a grayscale image) which then analyzed to identify the array spots and to measure their relative fluorescence intensities (for each probe-sets).

Every step in transcriptional profiling experiments can contribute to the inherent ’noise’ of array data.
Variations in biosamples, RNA quality and target labeling are normally the biggest noise introducing steps in array experiments. Careful experimental design and initial calibration experiments
can minimize those challenges.

Because of the nature of the process (the biochemical reactions and optical detections), subtle variations between arrays, reagents used, and environmental conditions may lead to sligthly different measurements for the samples. These variations give effects to the measurements: (1) Systematic Variaton which affect a large number of measurement simultaneusly and (2) stochastic components or noise, which are totally random. While noise cannot be avoided, it can be reduced, systematic variation could lead to differences in the shape and center of distribution from the measured data. When these effects are quite significant, gene expression analysis could results in false conclusion because of the variation compared does not result from biological reasons, but systematic error.

Therefore, normalisation would adjust systematic error / variation caused by the process. Thus, by adjusting the distribution of the measured intensities, normalization facilitate comparison and thus enables further analysis to select genes that are significantly differentially expressed between classes of samples. Failure to correctly normalise will invalidate all analysis of the data.

What kind of normalisation could be applied to a dataset?

Normalisation removes systematic biases from data. Normalisation usually applies a form of scaling to the data:

1. It could do scaling by physical grid position to remove spatial biases

Scaling by grid position was caused because there are significant difference in between grid positions. This problem could usually inspected visually. We expect that the intensity in between grid positions should be random, so when we see a patch or pattern between the grid that have different intensities, we could scale those grids up or down to match with other grids. This is also called fit surface or per pin normalisation, and sometimes occurs in dual channel approach.

2. It could remove intensity dependent biases
It uses Loess regression. Consider excluding elements which are not necessary Flagged absent across all experiments. Basically try to transform the data into more linear trend.

3. It could scale intensity values to remove per-chip variation
Per Chip Scaling. Log transform it. and do scaling. You could scale by its mean/median to normalize, make all the mean the same. but sometimes it does not address difference in shape distribution. Linear scaling does not correct distribution differences. Other powerful method is the Quantile Normalisation. this type of normalisation is powerful, and I will talk more about it in below.

4. Per gene normalisation
Uses distances. Genespring commonly assumes this normalisation has been applied.

Quantile Normalisation
Quantile normalisation replace the first value of chips with the first value of the reference until all values have been replaced. This will cause all values to have the same (reference distribution). Of course the probe sets at intensity position could be different for each sample. This assume that most of the genes will not expressed, so the distribution of the data should be quite similar.


Continue reading FGT Part 3 - Data Normalization for Microarray Data